
What It Does
Given two CSV files with spectral data in the form:
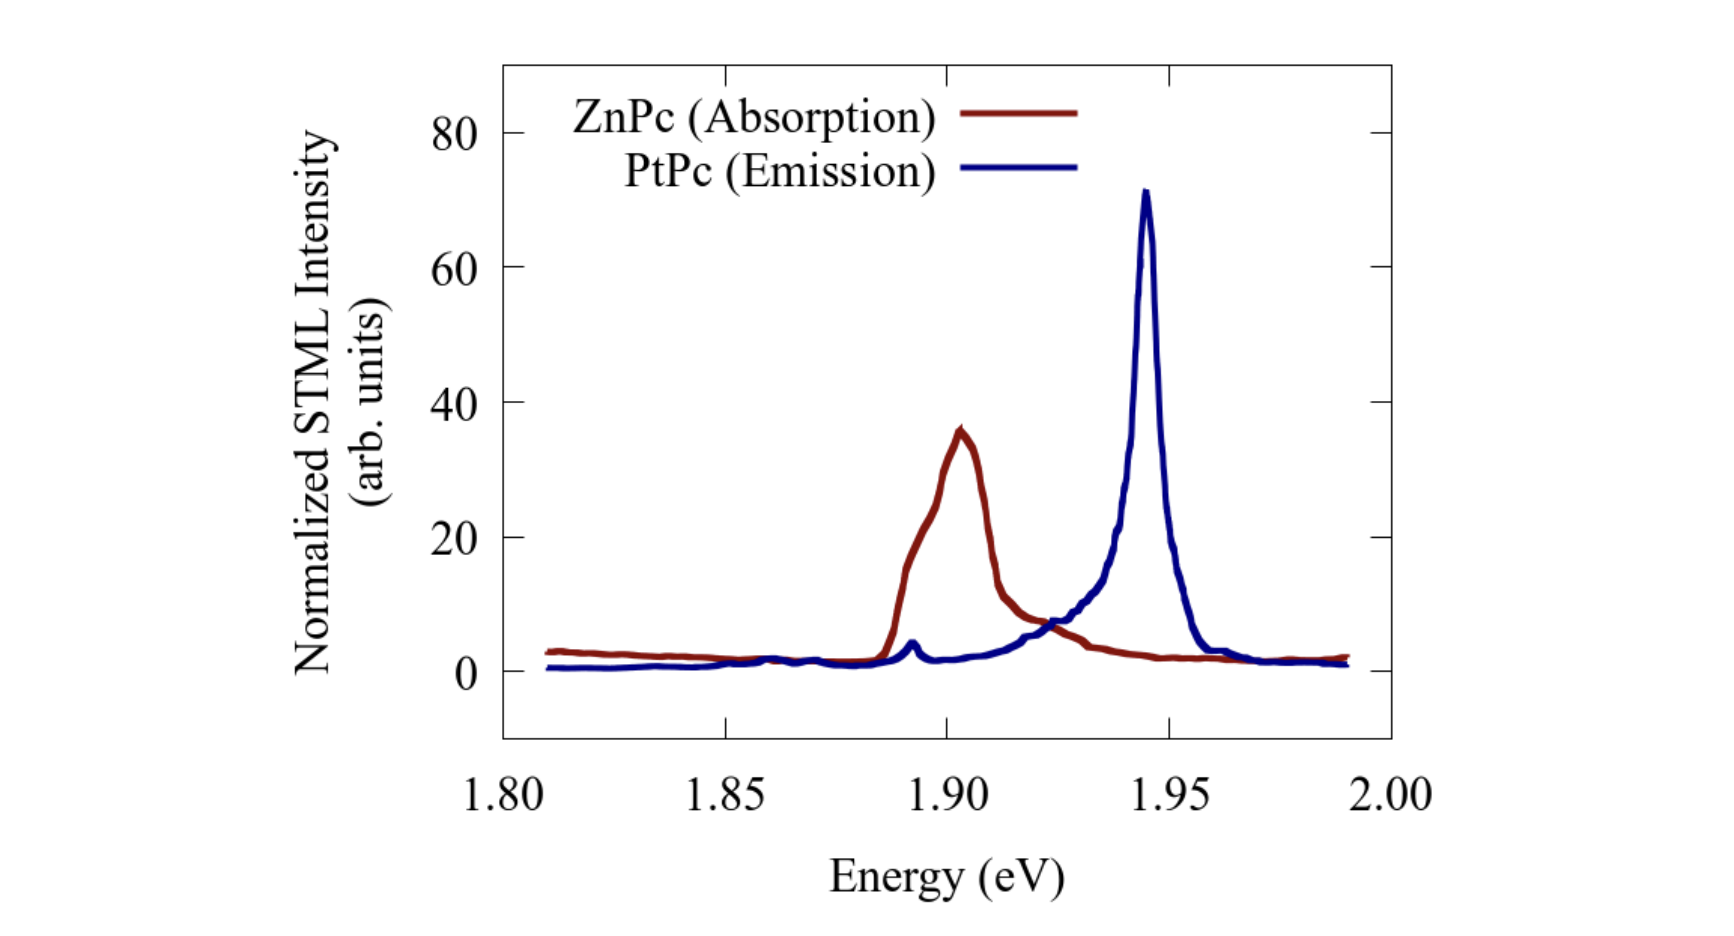
Energy (eV), Intensity (or Absorbance)the script:
- Interpolates both datasets to a fine energy grid
- Normalizes each spectrum
- Computes the spectral overlap integral:
$$ J = \int \text{Emission}(E) \cdot \text{Absorption}(E) \ dE $$
- Outputs normalized spectra and prints the overlap in units of eV⁻¹
Run the Script
Inside the folder absorption-emission-example/, you’ll find:
znpc-abs.csv– Absorption spectrum of ZnPcpdpc-em.csv– Emission spectrum of PdPc
These data are digitized from:
S. Cao et al., Nature Chemistry (2021)
https://doi.org/10.1038/s41557-021-00697-z
Use the example like this:
python3 spectral_overlap.py absorption-emission-example/pdpc-em.csv absorption-emission-example/znpc-abs.csvOutput
data1_norm.csv: Normalized emission data (donor)data2_norm.csv: Normalized absorption data (acceptor)- Console output includes the spectral overlap value
Funding
This project has been supported by the FARE 2020 program — "Framework per l’attrazione e il rafforzamento delle eccellenze per la ricerca in Italia."